← BACK TO HOME
GLOBAL OIL INTELLIGENCE · 1988–2026

WHAT MOVES BRENT?

The world events behind major movements in the Brent crude oil price. A historical record of supply shocks, demand collapses, wars and production decisions.

THE EVENTS BEHIND THE PRICE

Oil prices respond to changes in physical supply and demand. The events below are selected because they coincided with major, documented movements in the Brent market. Price references are identified as annual or monthly averages where applicable.

Brent Futures Trading Begins

Sassan oil platform, 18 April 1988
1988Benchmark milestone
1988 · Persian Gulf oil infrastructure · U.S. National Archives / Wikimedia Commons

The International Petroleum Exchange launched the Brent crude oil futures contract in 1988. This created a standardised, exchange-traded benchmark that became central to global crude oil pricing.

Why it matters: From this point, the Brent futures market provides a consistent historical reference for tracking how world events and market fundamentals are reflected in oil prices.
Brent annual spot average · 1988 $14.91

Iraq Invades Kuwait

Kuwait oil wells burning after the Gulf War
1990–1991War · Supply disruption
21 March 1991 · Kuwait oil fires · U.S. National Archives

On 2 August 1990, Iraq invaded Kuwait. The conflict removed Iraqi and Kuwaiti exports from the market and raised concerns about the security of Gulf oil supplies.

Supply impact: Exports from two major producers were disrupted and the risk to neighbouring production increased.
Aug 1990 monthly average $27.17Oct 1990 $36.02

Asian Financial Crisis

New York Stock Exchange trading floor
1997–1998Demand collapse
Archival trading-floor photograph · Library of Congress

The crisis that began in Asia spread across major economies, weakening industrial activity and oil consumption while available supply remained abundant.

Demand impact: Weaker economic activity reduced oil-demand growth and contributed to a market surplus.
1997 annual average $19.111998 $12.76

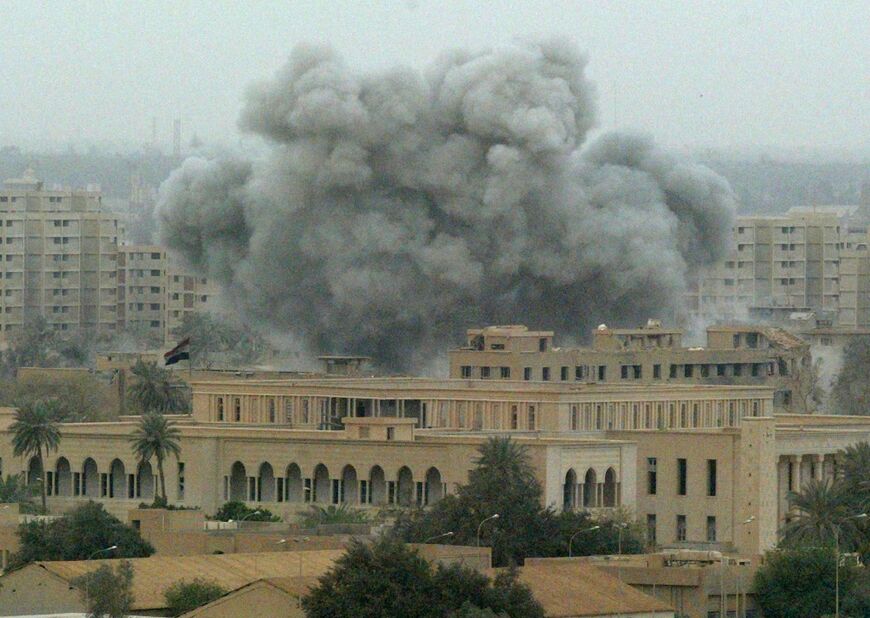
Invasion of Iraq

Smoke over Baghdad during the 2003 invasion
2003War · Supply risk
2003 · Baghdad · Al-Monitor photo archive

The US-led invasion began in March 2003. Fighting and damage to infrastructure disrupted Iraqi production and exports during the post-invasion period.

Supply impact: Iraqi output and export capacity were affected while regional security risks increased.
2002 annual average $24.992003 $28.85

Record Prices and the Global Financial Crisis

Lehman Brothers headquarters in New York during the 2008 financial crisis
2007–2009Demand · Financial crisis
15 September 2008 · Lehman Brothers headquarters · Robert Scoble / CC BY 2.0

Strong demand growth and limited spare production capacity helped push prices higher through 2007 and the first half of 2008. The global financial crisis then triggered a sharp contraction in economic activity and oil demand.

Demand impact: Strong consumption met limited spare capacity; then the financial crisis caused demand to fall sharply.
2008 annual average $96.942009 $61.74

Libya's Civil War and the Arab Spring

Ras Lanuf during the Libyan civil war
2011Civil war · Supply disruption
4 March 2011 · Ras Lanuf, Libya · Al Jazeera English / CC BY-SA 2.0

The uprising and civil war in Libya interrupted production and exports. Libyan light, low-sulphur crude was important to Mediterranean and European refiners.

Supply impact: Lost Libyan barrels tightened the market for compatible crude grades. Other producers increased output to partly offset the disruption.
2010 annual average $79.612011 $111.26

US Shale Growth and OPEC's Output Decision

Oil drilling rig
2014–2016Oversupply · Production policy
U.S. shale drilling context · U.S. Department of Energy / Public Domain

Rapid growth in US shale oil production added significant supply. In November 2014, OPEC decided to maintain its production target rather than immediately cut output to defend prices.

Supply impact: Rising non-OPEC production and continued OPEC output contributed to a global surplus and a prolonged price decline.
2014 annual average $98.972016 $43.64

COVID-19 and the Collapse in Oil Demand

JFK Airport terminal during COVID-19
2020Pandemic · Demand collapse
11 April 2020 · JFK Airport · FEMA / Public Domain

Travel restrictions, lockdowns and the sharp reduction in aviation and road transport caused an unprecedented fall in oil consumption. A price dispute between major producers added to supply pressure in March.

Demand impact: Global oil demand fell abruptly while production did not adjust immediately to the scale of the collapse.
Jan 2020 monthly average $63.65Apr 2020 $18.38

Russia Invades Ukraine

Fuel depot fire after Russian shelling
2022War · Sanctions · Supply risk
26 March 2022 · Lviv, Ukraine · State Emergency Service of Ukraine / CC BY 4.0

Russia's full-scale invasion of Ukraine on 24 February 2022 led to sanctions, changes in trade flows and uncertainty over Russian energy exports. Buyers and traders reorganised shipments and supply routes.

Supply impact: The risk of losing a large volume of Russian exports and disruption to established trade routes increased pressure on the global oil market.
Jan 2022 monthly average $86.51Mar 2022 $117.25

Iran Conflict and the Strait of Hormuz

USS Boxer transiting the Strait of Hormuz in 2016
2026War · Hormuz disruption
15 July 2016 · USS Boxer in the Strait of Hormuz · U.S. Navy

US and Israeli strikes on Iran began on 28 February 2026. Retaliation and attacks across the region disrupted shipping through the Strait of Hormuz, a route that normally carries a major share of global seaborne oil.

Supply impact: Reduced tanker traffic and interruptions to regional energy production created a major disruption to global oil flows.
Feb 2026 monthly average $70.89Apr 2026 $117.29
How to read the prices: Figures use the EIA Europe Brent Spot Price FOB series. Annual and monthly averages are not intraday highs, futures settlement prices or individual daily closes. Events can affect prices alongside other supply, demand, inventory and production factors; this page does not claim that any single event explains an entire price movement.

Historical Data & Sources

← BACK TO HOME